
Text, formulas, and graphics are fundamental mediums through which humans record, communicate, and disseminate civilization and scientific knowledge. Editing and inputting formulas and graphics are critical functions alongside text. However, despite the rapid development of the internet in the late 20th century, challenges remain in editing and inputting formulas and graphics online. Consequently, the internet still primarily relies on text and static images for communication, which significantly hampers advancements in education, network information architecture, and development in scientific research, engineering technology, and economic management.
In October 2009, our company successfully launched Web-GraphEdit, a web-based formula editing system compatible with various Internet Explorer browsers. This software allows users to edit and modify graphics online without the need for plug-ins, greatly facilitating communication, sharing, and professional interaction across disciplines via the internet.
Furthering our innovations, in October 2011, we introduced GraphEdit, a more versatile editing and calculation software. Its flexibility is evident in three main features:
Graphic editing, compared to formula editing, finds widespread application across nearly all aspects of work, life, production, education, technology, and publishing. Despite the plethora of graphic editing software available for local computers, long-standing issues with web-based graphic editing remain unresolved.
The prevailing method for creating and publishing web graphics involves using local software like Photoshop, Flash, or Matlab to create the artwork, then converting these into images in a specified format before uploading them to a web page. This approach has several drawbacks:

Integrated in


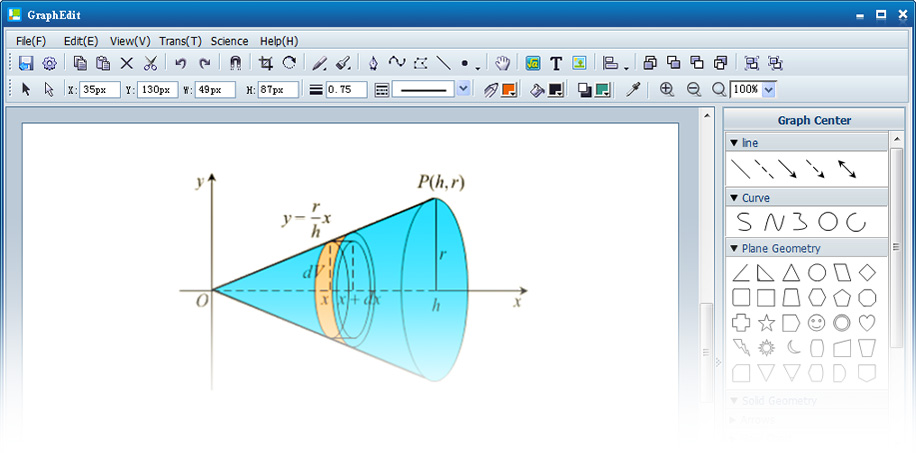
The system facilitates visual and computational editing of graphics, enabling online copying, pasting, and modification. No plug-ins are required on the client side.
DemonstrateThe data is formatted in HTML, enabling both local offline use and online interactive sharing. It is displayed in vector format, which allows for seamless scaling and produces clear printouts.
Demonstrate


The built-in mathematical formula editing software allows for annotating graphics with mathematical formulas in GraphEdit, and supports the search and identification of graphic elements.
DemonstrateThe system supports the creation of spline and Bezier curves based on mouse-selected points, as well as the generation of spline curves from data tables.
Demonstrate


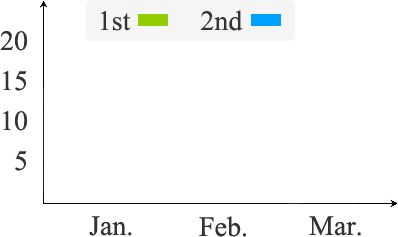
The system enables the creation of statistical graphics including histograms, column charts, pie charts, area charts, and curve charts from data tables. It also allows for easy editing and modification of these graphics through double-click interactions.
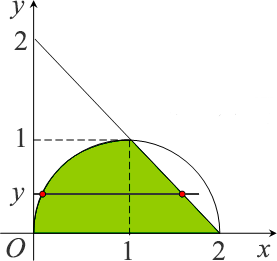
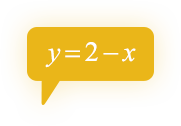
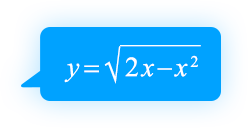
DemonstrateThe system supports the creation of 2D function graphics from one-variable function expressions visualized as formulas. These graphics can be easily edited, modified, and adjusted through double-click interactions.
Demonstrate


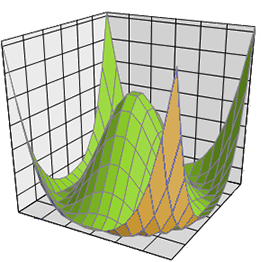
The system facilitates the creation of 3D function graphics from binary function expressions depicted through visual formulas. It also allows for easy editing, modification, and adjustment of these graphics via double-click interactions.
Demonstrate