
MathEditor & GraphEditor
being notable platforms authorized for business use.
Compared with formula editing, graphic editing is more widely used in work, life, production...[detail]
Text, formulas, and graphics are fundamental mediums through which humans record, communicate, and disseminate civilization and scientific knowledge. Editing and inputting formulas and graphics are critical functions alongside text. However, despite the rapid development of the internet in the late 20th century, challenges remain in editing and inputting formulas and graphics online. Consequently, the internet still primarily relies on text and static images for communication, which significantly hampers advancements in education, network information architecture, and development in scientific research, engineering technology, and economic management.
In October 2009, our company successfully launched Web-GraphEdit, a web-based formula editing system compatible with various Internet Explorer browsers. This software allows users to edit and modify graphics online without the need for plug-ins, greatly facilitating communication, sharing, and professional interaction across disciplines via the internet.
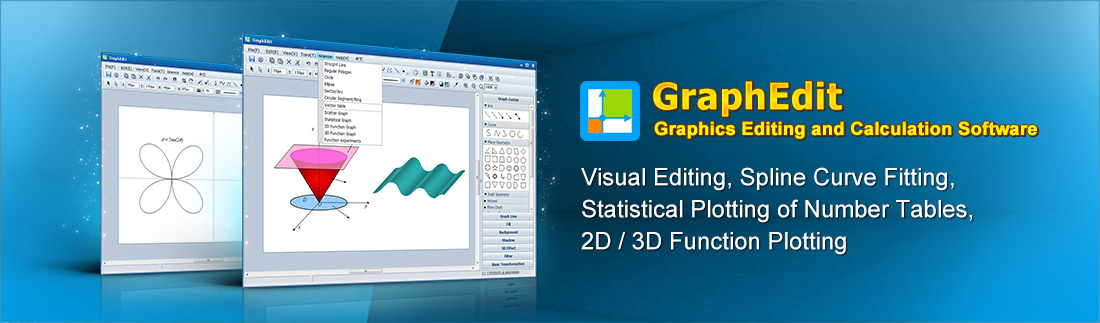
Furthering our innovations, in October 2011, we introduced GraphPlay, a more versatile editing and calculation software. Its flexibility is evident in three main features:
- 1. The graphic data format is HTML, enabling both native offline functionality and online interactive sharing.
- 2. It supports both hand-drawn designs and computational drawings derived from visual formulas and data tables.
- 3. It facilitates online networking interactions and can be integrated into various standalone and networked application software as a client.
Graphic editing, compared to formula editing, finds widespread application across nearly all aspects of work, life, production, education, technology, and publishing. Despite the plethora of graphic editing software available for local computers, long-standing issues with web-based graphic editing remain unresolved.
The prevailing method for creating and publishing web graphics involves using local software like Photoshop, Flash, or Matlab to create the artwork, then converting these into images in a specified format before uploading them to a web page. This approach has several drawbacks:
- 1. Network clients must install specific graphics editing software independently, which often requires professional skills and training.
- 2. Commonly used design features in programs like Photoshop are incompatible with the computational functions needed in educational and scientific settings, such as those offered by Matlab. Consequently, users must install multiple pieces of software, which can be inconvenient due to differing operational methods and habits.
- 3. Graphics created in popular editing programs must be converted to images and uploaded, complicating the process. These images can only be viewed online and do not support online editing or modification, nor do they facilitate graphics-based searches and recognition.
- 4. The quality of images on web pages is dependent on file size, often requiring larger files for higher quality, which diminishes print quality.
- 5. Web pages containing images load slowly, primarily due to image file sizes. These images not only consume significant server storage but also increase network bandwidth demands, escalating operational costs.
- The system facilitates visual and computational editing of graphics, enabling online copying, pasting, and modification. No plug-ins are required on the client side.
- The system supports the creation of spline and Bezier curves based on mouse-selected points, as well as the generation of spline curves from data tables.
- The data is formatted in HTML, enabling both local offline use and online interactive sharing. It is displayed in vector format, which allows for seamless scaling and produces clear printouts.
- The system enables the creation of statistical graphics including histograms, column charts, pie charts, area charts, and curve charts from data tables. It also allows for easy editing and modification of these graphics through double-click interactions.
- The built-in mathematical formula editing software allows for annotating graphics with mathematical formulas in GraphPlay, and supports the search and identification of graphic elements.
- The system supports the creation of 2D function graphics from one-variable function expressions visualized as formulas. These graphics can be easily edited, modified, and adjusted through double-click interactions.
- The edited graphic data is compressed and transformed into text annotations, significantly reducing server storage and network load.
- The system facilitates the creation of 3D function graphics from binary function expressions depicted through visual formulas. It also allows for easy editing, modification, and adjustment of these graphics via double-click interactions.
| Visual editing |
Numeral Calculations |
Fraction operations |
Auto save |
Manual save |
Local selection calculation |
Matrix Operations |
Matrix transformation |
Assignment operation of custom function |
|---|---|---|---|---|---|---|---|---|
| Free version | ● | ● | ● | |||||
| Premium version | ● | ● | ● | ● | ● | ● | ● | ● |